What is Veneur?
Veneur is a data pipeline for observing distributed systems. You can use Veneur for aggregating application and system data, like runtime metrics or distributed traces, and intelligently routing the data to various tools for storage and analysis. Veneur supports a number of these tools – called “data sinks” – such as SignalFX, Datadog, or Kafka. For this walkthrough, we’ll use Datadog.
Collecting pod-local metrics with Veneur
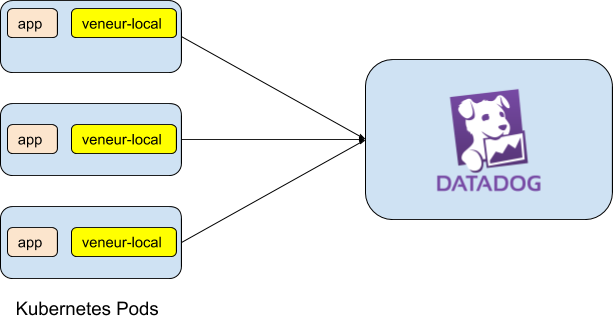
The first step to observing our services with Veneur is to deploy a local sidecar instance of Veneur inside our pod. To keep things simple, we’ll create a simple application whose only feature is to emit a heartbeat metric. We’ll do this using veneur-emit.
Veneur-emit is a convenience utility we wrote that allows us to emit statsd-compatible metrics at the command line for testing. It’s equivalent to using statsd client libraries (e.g. statsd) within an application. We wrote it to synthesize data transmission and is used in a similar way to netcat.. So the following netcat command:
$ echo -n “resp_success:1|c|#method:post” | nc -4u localhost 8126
could be written as
$ veneur-emit -hostport udp://localhost:8126 -count 1 -name "resp_success" -tag "method:post"
Basic Example
In this example, veneur-emit is a stand-in for any application you want to observe, if it’s instrumented using statsd client libraries. Since it’s the main application – and first container – in our pod, we’ll begin with the vanilla setup:
That’s the first container in our pod, and if we deploy it as-is, it’ll start faithfully firing off UDP metrics on port 8126. But there’s nothing listening on that port, so it’s just talking into the void. Let’s give it an audience by adding a second container in the same pod:
- name: veneur
    image: index.docker.io/stripe/veneur:3.0.0
Veneur requires almost no configuration out of the box; it defaults to working values. This new container is almost ready to start collecting metrics. However, without a Datadog API key, it won’t be able to send the metrics anywhere, so at the very least, we’ll need to configure our downstream data sinks.
Configuring a Pod-Local Veneur Collector
When running in non-containerized environments, Veneur can read its configuration from a file. But in Kubernetes, environment variables are more convenient. Thanks to envconfig, we can use these two forms of configuration interchangeably. Every config option specified in the yaml config example has a corresponding environment variable, prefixed with VENEUR_. So, we provide the following:
env:
    - name: VENEUR_DATADOGAPIKEY
      valueFrom:
          secretKeyRef:
              name: datadog
              key: datadog_api_key
For more information on setting the secret key values in Kubernetes, see the Kubernetes documentation on secrets.
In addition, we listen for UDP packets on port 8126 to receive the metrics, and we also listen for HTTP traffic on port 8127. Port 8127 is used for the healthcheck endpoint. It can also be used to listen for metrics that are emitted over TCP using authenticated TLS instead of UDP, but we won’t cover that here, as it’s not needed for most Kubernetes deployments.
So, putting it all together, we have:
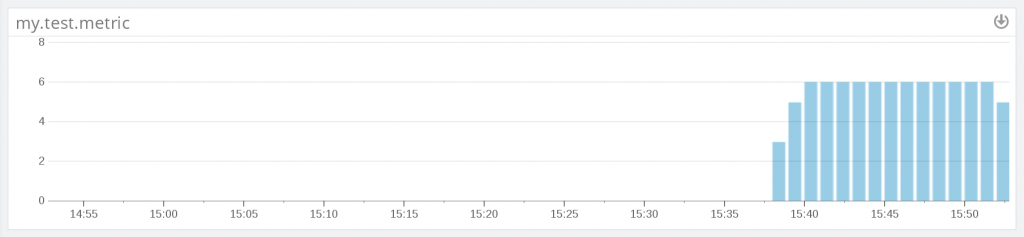
If we apply this deployment (`kubectl apply -f veneur-emit.yaml`), we’ll start to see these metrics come in, at the rate of six per minute. We’re sending metrics all the way from our application to Datadog!
If all you care about is collecting pod-local metrics, that’s it! You can stop here. But, there’s a good chance you want global metric aggregation as well. For that, we’ll have to add a little more.
Global Aggregation – How it Works
Veneur is capable of supporting global metric aggregation.
Let’s say you have an API server with 200 different replicas responding to stateless requests, load-balanced evenly across all instances. If you want to reduce your API latency, you probably want to know the 95th or 99th percentile for API latency across all 200 replicas, rather than the 99th percentile latency for the first pod, the 99th percentile for the second, and so forth. Having the separate latencies for the individual pods doesn’t help you, because percentiles aren’t monoids: there’s no mathematical operation to construct the global 99th percentile from the 200 different measurements of the 99th percentile on each pods.
Some time-series databases sidestep this problem by storing the raw data and performing the percentile aggregation at read-time, but this requires tremendous network, disk, and compute resources at scale, especially if we want good performance from our queries at read-time. Performing write-time aggregation reduces this load. But calculating percentiles before writing the results requires either sending all metrics to a single aggregator pod (which becomes a single-point-of-failure) or calculating them on a per-pod basis. Fortunately, Veneur has a nifty approach that gives the best of both worlds: global aggregate calculations at write-time, with no single-point-of-failure, and with an architecture that scales horizontally using existing Kubernetes primitives.
Veneur uses t-digests to compute extremely accurate percentile estimates in an online manner, using constant memory. While these percentile calculations are technically approximations, in practice, the error properties yield exact results for tail ends of the distribution, like the 99th percentile. Conveniently, that’s generally what we care about when observing our services, especially latencies.
Veneur’s provides a horizontally scalable mechanism for calculating global aggregates of timers, histograms and sets. The pod-local metrics – counters and gauges – are shipped off to Datadog immediately, but timers, histograms, and sets are forwarded to a separate service for global aggregation. The aggregation happens in two layers.
Veneur Proxy and Veneur Global
First, the pod-local veneur processes forward all timers, histograms, and sets to the veneur-proxy service, which is exposed by Kubernetes. Because Veneur is stateless, the choice of pod and node are arbitrary for the veneur-proxy service, and this can be handled by the built-in Kubernetes support for service discovery and load-balancing.
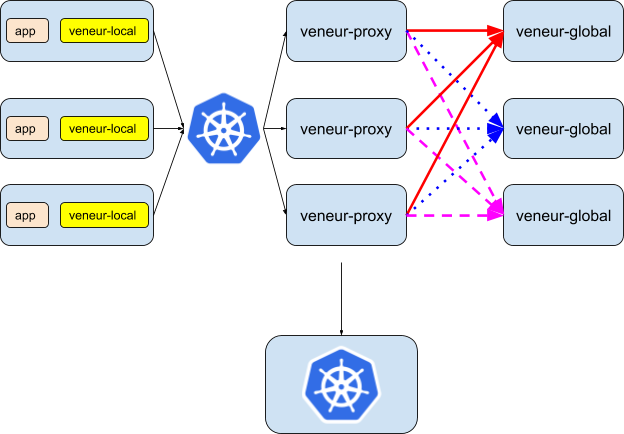
Under-the-hood, the veneur-proxy processes have to do a bit of coordination to split up their metrics properly. Assume that we have three proxy pods and two global pods, and that each proxy pod receives three metrics – named “red”, “blue”, and “pink” for convenience – from an arbitrary number of application pods. We can’t just lean on regular load-balancing within Kubernetes – we need to ensure that all metrics of the same name end up on the same global pod, or else we won’t have aggregated them properly.
Fortunately, this is all handled automatically by the veneur-proxy and veneur-global services. The veneur-proxy pods distribute the metrics consistently – all red metrics (the solid red arrow) end up on the same global pod, all blue metrics (blue dotted arrow) end up on the same global pod, and all pink metrics (dashed pink arrow) end up on the same global pod.
Of course, the number of replicas of the veneur-proxy and veneur-global services is arbitrary (and each veneur-global pod is capable of aggregating far more than one metric at a time!). Since both services are stateless, they can be horizontally scaled and adjusted dynamically to adapt to your particular metric load.
To create the veneur-proxy and veneur-global services, we just need to provide the following definitions.
For the proxy:
The second section is the same as what we saw before – veneur-proxy is a separate application binary, and for it to emit metrics about itself, we’ll want it to have its own, pod-local Veneur instance to talk to.
The global service configuration is even easier:
Resource Limits
While Veneur’s functionality extends beyond just collecting runtime metrics, compared to other dedicated metric collectors, Veneur’s resource usage is pretty lightweight. The portion that’s the most expensive computationally – global metric aggregation – is performed on dedicated pods (veneur-global).
Kubenetes has built-in support for resource limits, leveraging the power of cgroups in a convenient abstraction. We can use resource limits to cap the CPU and memory usage of the pod-local Veneur instances.
- name: veneur
  image: index.docker.io/stripe/veneur:3.0.0
  resources:
      limits:
          cpu: 25m
Invariants
With this three-tier setup, we maintain a number of useful invariants about our observability system.
- Stateless. Each Veneur process is entirely stateless. No data remains in memory for longer than ten seconds, so failure or eviction of a single pod running Veneur has very limited impact on our system’s overall observability.
- Distributed: There is no single point of failure. If any pod-local veneur process is killed and restarted, we only lose data for that pod, and only for one flush cycle. If any proxy or global veneur process is killed and restarted, we only lose ten seconds of data, and only for 1/n metrics (where n is the number of replicas we’re running).
- Horizontally scalable: We can run as many instances of the proxy and global boxes as we need to, to support arbitrarily large loads.
- Fault-tolerant: If a global veneur instance becomes unreachable, all proxy boxes will update their hashing scheme immediately for the next flush cycle.
Prometheus
Veneur also supports pull-based metric aggregation with Prometheus. veneur-prometheus is a separate binary which polls a Prometheus metrics endpoint to ingest metrics into the Veneur pipeline.
….and more!
We’re just scratching the surface of how Veneur can help you get better observability into your Kubernetes systems. Observability is not just about runtime metrics – it’s about request traces and logs as well. Veneur is an embodiment of the philosophy that logs, runtime metrics, and traces are all deeply connected, and that there should be an intelligent metrics pipeline handling all three.
If any of this excites or intrigues you – or if you have more thoughts on what kinds of visibility you need in your Kubernetes deployments, you’re in luck! Veneur is actively developed, with tagged major releases every six weeks. Drop us a line over on the issue tracker!
Acknowledgements
Thanks to Jess Frazelle, Kris Nova, and Cory Watson for reading drafts of this post!